
A real estate agency reporting dashboard is defined as a centralized, interactive interface that consolidates sales data, CRM records, property management metrics, and financial reporting into a single, real-time view for agency decision-makers. The industry term for this category is business intelligence dashboard, though real estate professionals increasingly use platform-specific names tied to tools like Power BI, Neudash, and RentViewer. Agencies that replace manual spreadsheet workflows with integrated dashboards gain measurable advantages: faster reporting cycles, fewer data errors, and the ability to monitor agent performance, portfolio profitability, and owner satisfaction from one screen. This guide covers the tools, build process, common pitfalls, and practical applications that matter most in 2026.
What is a real estate agency reporting dashboard?
A real estate agency reporting dashboard aggregates data from property management software, CRM systems, and accounting platforms into one structured view, replacing the fragmented, error-prone spreadsheet model that still dominates mid-market agencies. Automated dashboards integrate accounting, property management, and CRM data to create a single source of truth, which means agency principals stop reconciling three different reports and start making decisions from one. The practical result is faster month-end closes, fewer owner disputes, and a clearer picture of which parts of the portfolio are underperforming.
The distinction between a reporting dashboard and a static report is worth stating clearly. A static report is a snapshot delivered on a schedule. A dashboard is a live interface where users can filter by property, agent, date range, or market segment without waiting for a new export. For agencies managing more than 200 units or 10 active agents, that interactivity is not a luxury. It is the difference between reacting to problems after the fact and catching them before they affect revenue.

What data sources and tools power an effective dashboard?
Core data sources every agency needs
The three foundational data sources for any real estate analytics dashboard are property management software, a CRM system, and an accounting platform. On the property management side, Yardi, AppFolio, and Entrata are the dominant platforms for agencies managing residential and commercial portfolios. QuickBooks and Buildium handle accounting for most mid-market operators. CRM data, covering lead sources, referral conversion rates, and agent activity, typically comes from platforms like Follow Up Boss or HubSpot.
The challenge is that these systems do not talk to each other natively. Connecting disparate systems into a central data warehouse is more critical than expensive software selection, which means agencies that spend heavily on a new property management platform but skip the integration layer end up with the same fragmented reporting problem they started with. A managed data warehouse solves this by pulling from all three source systems into one queryable layer that feeds the dashboard.
Tool comparison: platforms for real estate data visualization
| Platform | Best For | Key Integration | Native AI | Typical Cost Tier |
|---|---|---|---|---|
| Power BI | Portfolio-level drill-down analytics | Yardi, AppFolio, QuickBooks | Limited | Mid to enterprise |
| RentViewer | Property management reporting | AppFolio, Yardi, Entrata | Moderate | Mid-market |
| Neudash | Owner reporting automation | Multiple PM systems | Strong (narrative) | Mid-market |
| Agentic Tools | AI-native CRM and reporting | MLS, CRM, marketing | Full AI stack | Growth teams |
| Tableau | Custom real estate data visualization | API-based, broad | Moderate | Enterprise |
AI-native platforms save scaling teams an estimated $50,000 over 24 months in software overhead compared to legacy models. That figure reflects the elimination of redundant point solutions, reduced manual labor, and fewer data reconciliation errors. For agencies evaluating total cost of ownership, the integration and automation layer often delivers more return than the reporting interface itself.
Key data inputs to configure from day one:
- Sales and pipeline data: active listings, days on market, closed volume by agent
- Occupancy and lease metrics: vacancy rate, lease expiration schedule, renewal conversion
- Maintenance and work orders: open tickets, average resolution time, cost per unit
- Financial performance: net operating income, rent collection rate, owner distributions
- Lead source tracking: marketing channel attribution, referral conversion rates
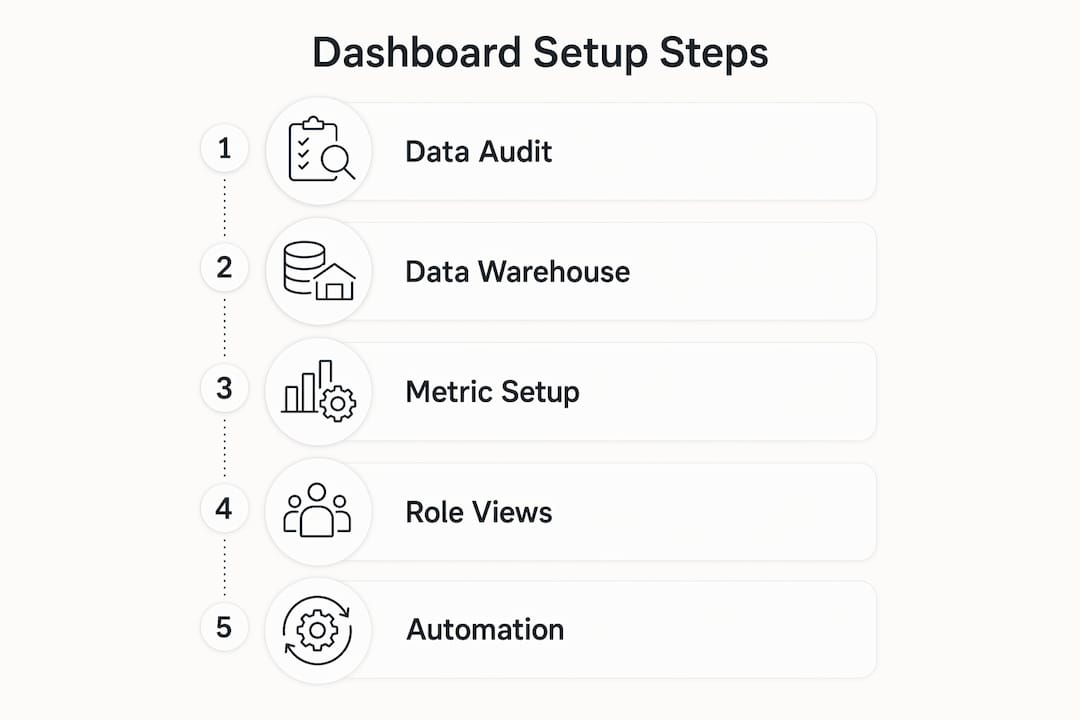
How to build your real estate dashboard step by step
Step 1: Audit your current data sources
Before connecting any tool, map every system the agency currently uses and identify where data lives. List each platform, the data it holds, and whether it offers an API or native export. This audit prevents duplicate fields and conflicting definitions (for example, two systems defining "vacancy" differently) from corrupting the dashboard from the start.
Step 2: Set up a central data warehouse or integration layer
For agencies managing 2,000 to 20,000 units, managed warehouse deployment connecting systems like Yardi and AppFolio into unified dashboards typically takes 10 days. Smaller agencies can use middleware tools like Zapier or Make to push data between systems without a full warehouse, though this approach has limits at scale. The goal is one queryable data layer that all dashboard views pull from.
Step 3: Configure your core real estate performance metrics
Connect the warehouse to your chosen BI or dashboard platform, then build metric definitions before building visuals. Define each KPI explicitly: occupancy rate is calculated as occupied units divided by total units, not as a field pulled directly from AppFolio (which may use a different denominator). Standardizing definitions at this stage prevents stakeholder confusion later.
Step 4: Build role-specific views
Agency owners, property managers, and individual agents need different views of the same underlying data. Owners want portfolio-level profitability and cash flow. Managers need maintenance resolution times and lease renewal pipelines. Agents want their own conversion rates and pipeline velocity. Owner-facing dashboards should use narrative generation and forward-looking projections to give clients control and increase satisfaction, which means the agent view and the owner view should be built as separate report layers, not the same screen with different filters.
Step 5: Automate delivery and alerts
Schedule automated report delivery to each stakeholder group on a cadence that matches their decision cycle. Owners typically receive monthly summaries. Managers need weekly operational snapshots. Set event-driven alerts for critical thresholds: vacancy above 8%, maintenance tickets open beyond 72 hours, or rent collection below 95%. These alerts convert the dashboard from a passive reporting tool into a proactive management system.
Pro Tip: Build your alert thresholds before you go live. Agencies that add alerts after launch tend to set them reactively, after a problem has already surfaced. Define acceptable ranges during setup, when the data is clean and the team is aligned.
Common challenges in dashboard implementation
Data fragmentation is the most common barrier agencies face when deploying a property management reporting tool. Systems like Yardi, AppFolio, and QuickBooks each use proprietary data schemas, and mapping fields across platforms requires deliberate configuration, not just a plug-and-play connection. Agencies that underestimate this step often end up with dashboards that display data but cannot be trusted for decisions.
A second challenge is over-reliance on built-in software reports. Successful large-scale agencies move beyond built-in property management reports to professional BI tools like Power BI for flexible, drill-down analytics from portfolio to unit level. Built-in reports are designed for compliance and basic operations, not for the kind of cross-system analysis that reveals which property manager is driving the highest renewal rates or which marketing channel produces the lowest cost-per-lease.
Additional challenges to plan for:
- Data accuracy drift: Source systems get updated, and dashboard field mappings can break silently. Schedule a monthly data audit to catch discrepancies before they affect owner reports.
- Stakeholder preference fragmentation: Different owners want different report formats. Automation platforms like Neudash handle this through templated, personalized delivery rather than manual customization for each client.
- Scaling without rebuilding: Dashboards built for 500 units often break at 2,000. Design the data model for the agency's three-year growth target, not its current portfolio size.
Pro Tip: Prioritize data integration over dashboard aesthetics. A visually polished dashboard built on fragmented data is less useful than a plain table built on a clean, unified warehouse. Get the data layer right first.
How dashboards improve agency decisions and performance
Monitoring agent performance with precision
A dashboard for real estate agents tracks referral conversion rates, pipeline velocity, and closed volume by agent in real time, replacing the quarterly review with a continuous performance signal. Agencies using this data can identify which agents need coaching before a bad quarter becomes a retention problem, and which top performers are ready for expanded territory or team leadership.
AI-powered price prediction models deliver over 85% accuracy on MLS data in under 10 seconds, which means agents equipped with dashboard-integrated valuation tools can price listings more accurately and reduce days on market. That accuracy directly affects seller satisfaction and referral rates, two metrics that compound over time in ways that are invisible without a dashboard tracking them.
Tracking portfolio profitability and owner satisfaction
| Metric | What It Measures | Decision It Drives |
|---|---|---|
| Net operating income by property | Revenue minus operating expenses | Disposition or reinvestment decisions |
| Rent collection rate | On-time payments as a percentage of total due | Collections process adjustment |
| Maintenance cost per unit | Total maintenance spend divided by unit count | Vendor contract renegotiation |
| Owner distribution accuracy | Distributions sent vs. scheduled | Owner trust and retention |
| Lease renewal conversion rate | Renewals as a percentage of expiring leases | Retention campaign targeting |
AI-driven narrative reporting generates insights explaining data trends, such as maintenance costs linked to asset age, which increases owner retention and trust. This matters because owners who understand why a number changed are far less likely to dispute it or switch management companies than owners who receive a raw figure with no context. Narrative generation is the feature that converts a reporting dashboard from an internal tool into a client retention asset.
Explore real estate analytics insights covering how business intelligence is reshaping unified reporting for agencies managing complex, multi-owner portfolios.
Key takeaways
A real estate agency reporting dashboard delivers its highest value when built on a unified data warehouse that connects property management, CRM, and accounting systems before any visualization layer is added.
| Point | Details |
|---|---|
| Unified data layer first | Connect Yardi, AppFolio, and CRM systems into one warehouse before building any dashboard views. |
| Role-specific reporting | Build separate views for owners, managers, and agents to match each stakeholder's decision cycle. |
| AI narrative adds retention value | Narrative-driven owner reports explain data trends and reduce client churn more than raw metrics alone. |
| BI tools outperform native reports | Power BI and RentViewer deliver drill-down analytics that built-in PM software reports cannot replicate. |
| Alert thresholds drive proactive management | Configure vacancy, maintenance, and collection alerts at setup to convert dashboards into early-warning systems. |
Why most agencies are still building dashboards backwards
The conventional advice on real estate reporting dashboards focuses almost entirely on which platform to choose. That framing gets the problem backwards. The platform is the last decision, not the first. Every agency I have observed that struggled with dashboard adoption made the same mistake: they selected software based on a demo, then discovered their data was too fragmented to feed it properly.
The agencies that get this right start with a data audit. They map every system, every field, and every definition before they open a single vendor proposal. When the data layer is clean and unified, almost any BI platform, whether Power BI, RentViewer, or a custom-built solution, will perform well. When the data layer is fragmented, even the most sophisticated platform produces reports that no one trusts.
The second thing most articles miss is the owner-facing dimension. Internal dashboards for managers and agents are useful, but the real competitive advantage in 2026 comes from what agencies deliver to property owners. An owner who receives a monthly report with AI-generated narrative explaining why maintenance costs increased, paired with a forward-looking projection for the next quarter, is an owner who renews their management contract. That is the business case for investing in narrative generation features, not just data visualization.
My forecast is that within two years, AI-generated narrative reporting will be a baseline expectation from institutional property owners, not a differentiator. Agencies that build that capability now will have a structural advantage when that expectation becomes standard.
— Dustin
Explore real estate analytics solutions at Insideiris
Insideiris tracks the technology infrastructure that powers high-performance real estate agencies, including the dashboard platforms, integration layers, and BI tools covered in this guide. The real estate data analytics section at Insideiris provides structured comparisons of reporting platforms, integration tools, and automation solutions tailored for agencies managing complex portfolios.
For agency owners evaluating their current tech stack, Insideiris maps the full spectrum of property management reporting tools, from mid-market solutions to enterprise BI platforms, with integration capability data and cost benchmarks that go beyond vendor marketing. The platform routes decision-makers directly to the tools that match their portfolio size, data complexity, and reporting requirements. Visit Insideiris to access the full real estate technology index.
FAQ
What is a real estate agency reporting dashboard?
A real estate agency reporting dashboard is a centralized BI interface that pulls data from property management software, CRM systems, and accounting platforms into one live, interactive view. It replaces manual spreadsheet reporting with automated, role-specific analytics for owners, managers, and agents.
How long does it take to set up a real estate reporting dashboard?
For agencies managing 2,000 to 20,000 units, managed dashboard deployment connecting systems like Yardi and AppFolio typically takes 10 days. Smaller agencies using middleware integrations can often configure a basic dashboard in under a week.
What are the most important real estate performance metrics to track?
The core metrics are occupancy rate, rent collection rate, net operating income by property, lease renewal conversion rate, and maintenance cost per unit. Agent-level dashboards should also track referral conversion rates and pipeline velocity.
Which tools are best for real estate data visualization?
Power BI and RentViewer are the leading choices for portfolio-level drill-down analytics, while Neudash specializes in owner-facing reporting automation with AI narrative generation. The best tool depends on portfolio size, integration requirements, and whether the primary use case is internal management or owner communication.
How do AI features improve real estate dashboard reporting?
AI-driven narrative generation explains data trends in plain language, such as linking a maintenance cost spike to asset age, which increases owner trust and reduces client churn. Price prediction models integrated into agent dashboards also deliver over 85% accuracy on MLS data, supporting faster and more accurate listing decisions.